Election Swings & Trends
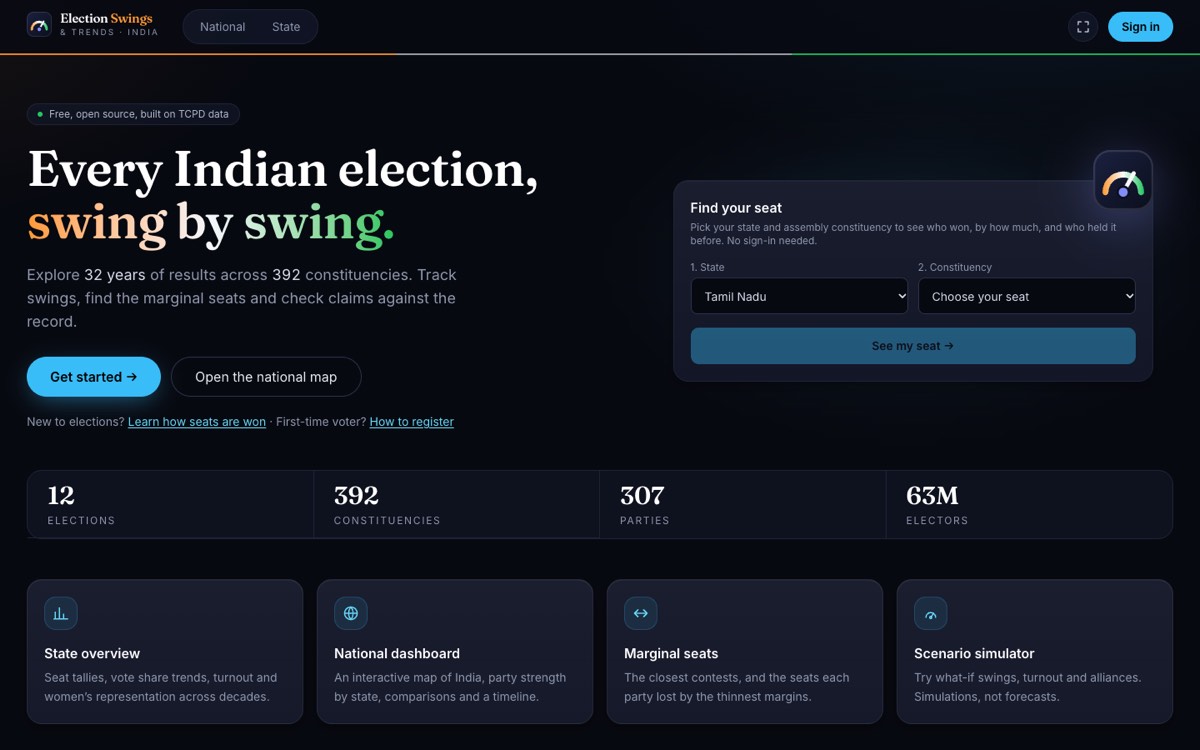
Look up any seat, see who held it and by how much, then test what-if scenarios. The simulations show what past patterns imply, and they are not forecasts.
FastAPI, React 19, PostgreSQL, XGBoost, ONNX, Terraform, Railway
Overview
A full-stack election analysis platform for exploring historical constituency results and running what-if simulations across Indian states. Its predictions are mathematical simulations based on past patterns and adjustable assumptions, not electoral forecasts.
Architecture
The platform follows a three-tier architecture: a FastAPI backend serving simulations from XGBoost models exported to ONNX format, a React 19 frontend with interactive constituency maps, and a PostgreSQL database storing historical election results from the TCPD dataset.
Infrastructure is provisioned via Terraform on GCP, with the application deployed on Railway for zero-ops hosting. The ML pipeline trains on historical data, exports to ONNX, and serves simulations through a REST API.
Key Features
- Scenario simulator — adjust swings, turnout and alliances to see the effect on seats
- Historical trend analysis — visualizations spanning elections from 1977 to present
- Interactive maps — click any constituency to see detailed breakdowns
- Admin panel — manage election data, trigger model retraining
- Marginal seats — the closest contests and the seats each party lost by the thinnest margins
Technical Highlights
The ONNX export lets the FastAPI backend serve XGBoost models without a Python ML runtime in the request path. The frontend is built with React 19 and Vite.
The data pipeline ingests CSV files from TCPD (Trivedi Centre for Political Data), normalises party names across decades of alliance shifts, and produces clean training features per constituency.